Poll Scheduling and Tuning Policies - a Quick Overview
Some protocols such as Modbus and BACnet (for certain devices) depend on a master or client, e.g. a Jace, requesting data from a slave or server e.g. electricity meter or VSD. If this data is required on a regular basis, e.g. for wiresheet logic or histories, the data request needs to be initiated by the master/client and scheduled appropriately - this is where the Poll Scheduler or Poll Service comes in - it provides three different poll rates to make sure each proxy point is refreshed at the required rate, manages each polling "bucket" for each rate to ensure it gets the data at the required rates using minimal processing resources and gives you statistics to show you if it is working as expected, has spare capacity or is struggling.
That covers reading data into the Tridium framework, but what about writing data to the 3rd party protocol devices (Modbus slaves etc.)? The Niagara drivers are cleverly engineered to keep processing and comms loads as low as possible by only writing data when absolutely necessary, i.e. usually only when a change occurs in the Niagara world, e.g. a proxy point numeric writeable setpoint is changed or wiresheet strategy determines an output needs changing (change postion of valve, start pump etc.). However, when hardware loses power or comms or when fluctuating values cause wiresheet strategy to change outputs at a very high rate, additional enhancements may be required to the standard behaviour to make sure network traffic is not unnecessarily heavy or comms breakdowns do not leave systems unsynchronised. This is where the Tuning Policy comes in - it has settings to ensure writes cannot happen too frequently or to ensure writes happen on a regular basis regardless of output changes and settings to determine if writes should happen in different scenarios to ensure data stays synchronised between the real world and Niagaraland. There is also a setting to determine when points go stale when they are being subscribed to and reads are not received in a timely manner - this would seem to sit more logically under the Poll Scheduler as it deals with reading proxy points and needs to be set with respect to poll cycle times, but I'm sure there must be a very good reason it resides here (I just can't think of it right now!).
Poll Scheduler Settings
Planning Your System
It's well worth asking yourself a couple of questions before you start allocating quantities of points to a particular driver network -
- How often do I really need to get each proxy point's value?
- Which ones are subscribed constantly and which ones only as required?
Typical criteria might be -
- Constantly subscribed points -
- Wiresheet input connected points, e.g. temperature reading for comfort control - every 15 seconds is usually fine
-
- Energy consumption data - every 15 minutes
- Life safety critical control data, e.g. fire alarm, smoke damper status OR lab pressure control - every 1 second
- Proxy points with history extensions - as per other criteria
- Subscribe when required points
- Monitoring temperature charting - 5 seconds
- Data to be viewed on PX page, monitoring only, temperature, power etc. - every 5-30 seconds depending on customer refresh requirements
Once you've established how many points are involved and how often they need refreshing, it's worth doing a quick fag-packet calculation to see if a single network can cope - Tridium recommend you aim to keep the Poll Scheduler/Service below 75% busy when polling only permanantly subscribed points so that there is plenty of spare capacity for other points to be polled when required, e.g. when a user opens a PX to view plant or charts a value or an engineer opens a Workbench proxy point view. Here's an example -
- 32 Modbus RTU meters with 15 values each to be read = 480 points
- Customer requires viewing all values on PX with 10 second refresh and history extension on all points 15 minute interval (i.e. they will be permanently subscribed)
- All points need to use the poll cycle rate of 10 seconds - assume each poll takes about 40ms therefore -
- Total estimated poll cycle time for all data = 480 x 0.04 = 19.2 seconds - TOO LONG!
In this case, where you cannot meet the criteria with a single RS485 network, there are a number of alternative approaches you can take -
- Get the customer to agree to a 30 second poll cycle time - this should be acceptable, but it doesn't hurt to manage expectations at an early stage - this should give you a busy time of well under 75%
- Split the meters across three RS485 networks - extra costs involved
- Look carefully at the Modbus registers to see if sequential registers can be read as one poll using the "Device Poll Config" under the driver Modbus Device container - if you can read each device's data with only 5 polls instead of 15, the busy time should be well within 75% - please see this article for more details - How do I optimize Modbus for the fastest speed in Niagara (and in general)
Poll Scheduler - Performance Analysis and Tuning
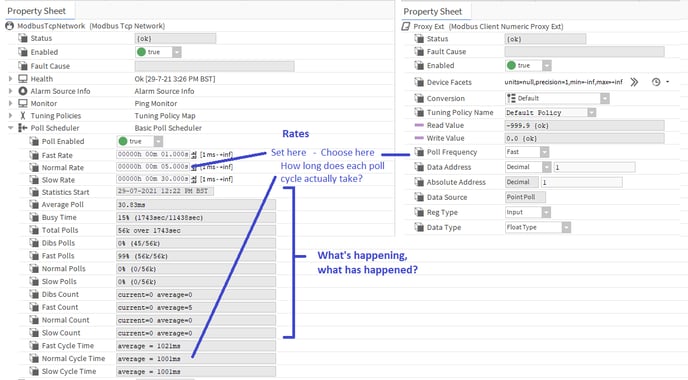
Once you've configured your station by adding all the required points, setting-up the poll rates as required and allocating each proxy point to the correct poll rate, you can now check the poll scheduler statistics to see if all is well. Here's an overview of the stats and what they mean -
Let's run through each field to look at how we can use the information to make an informed decision as to if points are being polled efficiently or not and on what adjustments or remedial work is needed, if any -
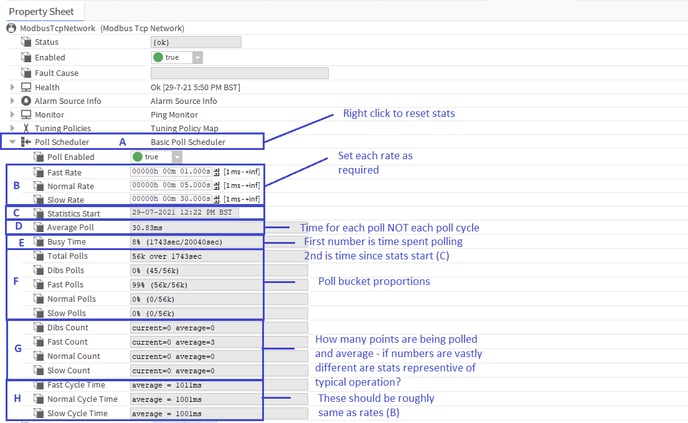
A - Poll Scheduler - if you right click on this, there is an Action option to reset the statistics - this is useful if you make a major adjustment to the network driver or some other unknown factor has recently come into play and want to see its effect without the resultant data being skewed by the historic data, e.g. if the busy time had been running at under 75% for the last 3 months then you decide to add another 100 points to the driver network, if you watch the "Busy Time" (E) for 20 minutes you may see it only rise to 78% even though the busy time had in fact rocketed up to 99% in the 20 minute period. This is because the busy time is calculated over the time since the last "Statistics Start" (3 months ago). If you reset, the stats will start again and you will quickly see the REAL effect your changes are having
Note - the statistics update every 10 seconds
B - Rate Times - this is where you set the desired time you want ALL points allocated to each poll rate "bucket" (slow, normal, fast) to be read periodically, i.e. the poll cycle must try to read all points in the buckets within these set times - it may succeed or it may not, it depends on how you have loaded the driver's polling. Where there is plenty of time to poll all the required points, the scheduler will space out the reads in the time you've set to allow quiet gaps for other reads, e.g. "dibs" polls when you first open a PX or add new points etc. In this case, the "Busy Time" should be 75% or lower. If there is not enough time to poll all the points, the busy time (E) will start rising towards 99% and you will see cycle time (H) rise above the rate you set - setting a lower time will not get the scheduler to speed things up to improve the situation, that would be a bit like having your foot to the floor in your car then trying to press a bit harder on the accelerator to speed up - it's doing all it can, it can do no more! Also, when the Busy Time rises above 90% Jace CPU usage will probably rise to a similar level and the station may start to run slowly and erratically causing other issues in the station outside of the driver network polling. To correct this issue, you have a number of areas to look at -
- Increase the rate to allow more time for polling of all points in rate bucket to get busy time below 75%
- Move some less time critical points to a different rate bucket with a longer rate time, e.g. from "Normal" to "Slow"
- Remove unnecessary points and/or history extensions - do you really need them all?
- Check the network is performing well - if average poll time (D) is unusually high, there may be problems with the network installation or a slave/server is running slowly and cannot process the read requests in a timely way
C - Statistics Start - this time and date will be reset when the station restarts or you manually reset by right clicking and choosing the reset action
D - Average Poll - this is the average time that a poll takes (over the period from Statistics Start to when you read it), i.e. how long does it usually take to read a 3rd party point or set of points in a single read operation - not to be confused with a poll cycle time i.e. the time taken to read ALL points in a poll rate bucket, e.g. "Normal"
This can indicate poor network or hardware performance if unusually high
E - Busy Time - this adds up ALL the poll times (how long each poll read took) over the time since the stats started (C) then expresses them as a percentage of the total time the statistics have been running for, e.g. total poll times = 1743s, total stats run time = 80623 busy time = 1743/80623 x 100 = 2%, or to put it another way, for the past 22 hours or so the poll scheduler only spent about 30 minutes of that time polling 3rd party devices for data - not very busy at all, plenty of capacity for more polling = good.
If you see a busy time > 75% you need to have a look to make sure this isn't a potential issue
If you see a busy time > 95% this means the scheduler is spending pretty much all of its time polling and needs looking at very carefully to see if it is a blip or a continual state of busyness
This should be your first port of call when looking at how the polling is performing
BACnet Networks have two threads contributing to busy times so you may see a busy time in excess of 100% - this is the busyness of the two threads combined so you need to divide by two to get the average thread busy time
Whether you see a good busy time or a bad busy time, this is only part of the story and we need to look closely at the other fields and possibly reset the stats to determine exactly what is going on
F - Poll Bucket Proportions - this shows us which points are causing the biggest load on the scheduler and hence who the trouble makers are most likely to be. It gives stats for % of total polls and numbers for specific bucket polls per total polls
The Total Polls time is the same figure as the first time figure in the Busy Time field, i.e. the actual total time taken to poll data since the stats started
G - Poll Bucket Counts - this tells you how many polls are currently in each bucket against how many it usually deals with (average) - points or groups of points will be dropped into the bucket they are set to when they become subscribed either permanently (when attached to wiresheet logic inputs or history/alarm extension) or temporarily when viewed in Workbench or PXs - in the latter case, they will drop into the "Dibs" bucket first to get instantly polled (Dibs polls always jump to the head of the queue and a later Dibs request trumps a previous Dibs request, i.e. last in first out to make the user experience as quick as possible). After that, they will move to the bucket they are set for (slow, normal or fast) whilst the view/PX is kept open to refresh the data periodically.
Therefore, typically, you will have a "base" set of permanently subscribed points in each bucket and fluctuations as people use the system to look at Workbench views and PX views.
With that in mind, if you see a major difference between current and average, it could tell you a number of things -
- If Current is significantly > Average
- There are a lot of users accessing PX views currently and it could just be a blip
- You or another engineer have left a lot of Workbench views of the related points open, so this would not be a factor in normal operation
- A major change in the station config has recently occurred that has put more permanently subscribed points into the bucket - this may not have had time to impact the Busy Time and Cycle Times yet and it may be worth resetting the statistics to see its real effect
- If Current is significantly < Average
- You have caught the station at a quiet time when users aren't accessing it and the trend is for the polling to be much busier than what you are seeing, e.g. a customer has reported a problem that only happens at certain times and you are not currently seeing the problem scenario
H - Cycle Times - this is probably the most telling stat on how each poll bucket is performing as it shows you if the poll cycle you set for each bucket is meeting its target or not. To explain - usually the cycle time will be roughly the same as the rate time set (B) even if it is not very busy - this is because the scheduler uses all the time you give it to get through the cycle to keep "quiet" gaps between reads during the cycle for other activity, e.g. Dibs polls. As you drop more points into a poll bucket, the quiet times will get less and the cycle time stays roughly the same UNTIL it has no more quiet time available and then if further points are added the cycle time will start increasing above the rate time as it cannot complete the cycle in the given rate time and is constantly busy.
Assessing the Overall Problem
If you do find the "Busy Time" is getting above 75% or even as high as 99% and there is little you can do to improve matters without major work, this may or may not be a real issue - we mentioned it could be an issue if many other points could need to transition to subscribed to show data on PX pages or if the polling is causing the CPU % usage to get close to 100% and it could affect other station operations. However, it could be that ALL points are permanently subscribed so no further strain on the polling can occurr or that the station does little else in addition to polling and logging data, e.g. no wiresheet strategy or PX pages and it can reliably run at a high state of poll and CPU usage without causing any issues - each individual scenario needs to be assessed to decide what if any action needs to be taken.
Tuning Policy Settings
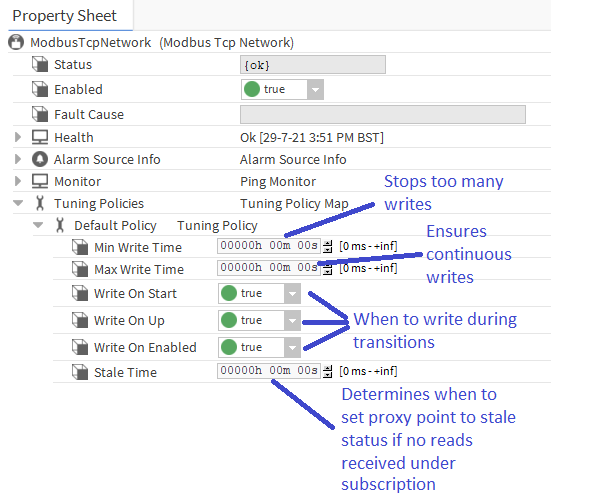
Let's have another look at the default tuning policy for a Modbus network driver -
Essentially, these settings are mostly related to "write behaviour" with one setting for stale time that is more related to the reading function carried out by the poll scheduler. Let's go through them and discuss where we might want to make some tweaks -
Min Write Time - this is by default set to 0 and leaves the driver to make writes to 3rd party points whenever a change occurs to the respective proxy point by being written to by user action or wiresheet modules writing to one of its inputs. This works fine a lot of the time, but there may be scenarios where the wiresheet strategy could on occassion, or continually, be driven by rapidly changing inputs and cause numerous writes to flood the network. These writes could start snowballing and grind comms to a halt. This setting can prevent this by ensuring each proxy point cannot write to the 3rd party again until this time has elapsed after the previous write. E.g. if set to 5 seconds and the value is changing every 1/100th of a second, it will make a write, the value will change 50 times in 5 seconds but only the last change will be sent after the 5 seconds has elapsed thereby throttling the comms.
Max Write Time - as per above, this is normally set to 0 to allow the same driver behaviour described, i.e. writes only happen on change or during station starts, device transition to "up" or point transition to enabled. However, there may be occassions when it is advantageous to addtionally have a periodic write to the 3rd party from all proxy points normally only being driven by user actions or wiresheet strategy value changes. For example -
- If a power failure on site occurs and power reinstates before the station ping failure occurs (to set the 3rd party device as "down") and the 3rd party device sets any of its points to a default state when power is lost (e.g. unoccupied), without the Max Write Time set, the station would not write to the value again until the next time it transitions, e.g. unoccupied to occupied and the 3rd party controller will keep the plant off until that time, e.g. the next morning - if Max Write Time was set to 10 minutes, the power failure condition would soon recover when the proxy point makes a write when the 10 minute period has elapsed and the two systems would then be fully synchronised and plant operating as desired (assuming the power comes back too!)
Write On Start - this ensures a write occurs when the station starts to make sure any synchronisation loss during station down time is recovered immediately - consider setting this ONLY for proxy points attached to critical operations, especially on large networks, as this may place significant load on the station resulting from numerous points writing on start-up and could cause a write queue overload exception
Write On Up - this ensures a write occurs when the device transitions from down to up after a network, power or hardware failure to make sure any synchronisation loss during the down time is recovered immediately
Write On Enabled - this ensures a write occurs when the proxy point transitions from disabled to enabled
Stale Time - this sets the time to set a proxy point to "stale" status if a read is not successfully made within this time. Two things to note -
- If set to 0, the timer is inactive and points will only go from ok to stale when they are unsubscribed, e.g. not being viewed on a PX or Workbench view and not attached to wiresheet strategy inputs or alarm/history extensions
- If set to above zero, they behave as described - make sure you set to AT LEAST the longest expected poll cycle time or points may go stale in between reads which can interfere with wiresheet logic etc. as they may be ignored when stale, e.g. a kitControl And module with two inputs linked to proxy points and the rest null will output 1 if one input is True and the other goes to stale (irregardless of its output value when it went stale)
Tip - for more complex set-ups, more than one tuning policy will need to be created to cater for different point needs, e.g. DefaultPolicy, DontWriteOnStartTuningPolicy, StaleTime10minsTuningPolicy, etc.
Note - there are some differences between drivers in how Tuning Policies and poll rates are applied, where they are found under the driver and some drivers have additional settings to work with their enhanced functionality. E.g. BACnet uses COV (change of value) and has settings for that too - please see the relevant Niagara documents for each driver