You might have manually exported a history chart view, and wondered how to get a more clever strategy in place to put together different history data, and why not export it automatically to CSV files.
This is what we are going to explore in this article
What we need, modules
For this application to work we will use some standard modules, so if you are going to use a Jace, make sure you install them
- KitControl
- History
- Report
- SeriesTransform
- VykonPro
- Email (optional, if you plan to send the CSV via email)
Please download the CSV_Export example station from our support website HERE
Creating some history data
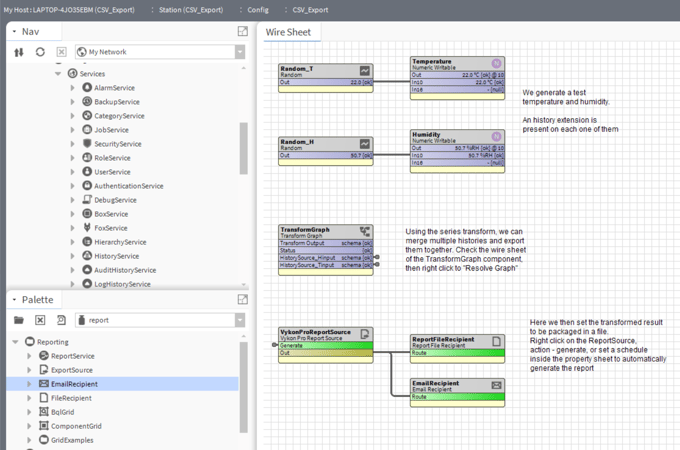
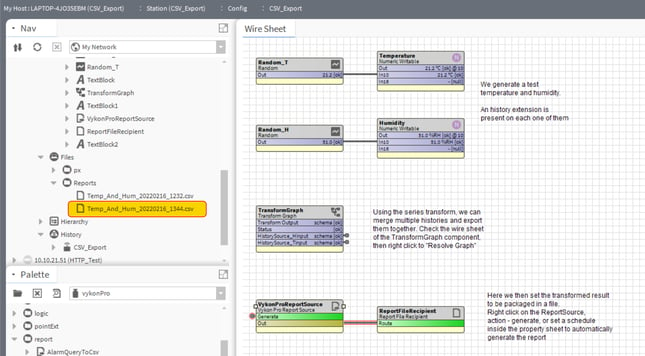
For this article, we start by creating some example history data: a nice clean folder called "CSV_Export" where to put all our logic, starting with a temperature and a humidity value, randomized every 5 seconds and logged every 5 seconds using a "NumericInterval" extension from the "history" palette. Remember to enable the history collection on the history extension or within the history service
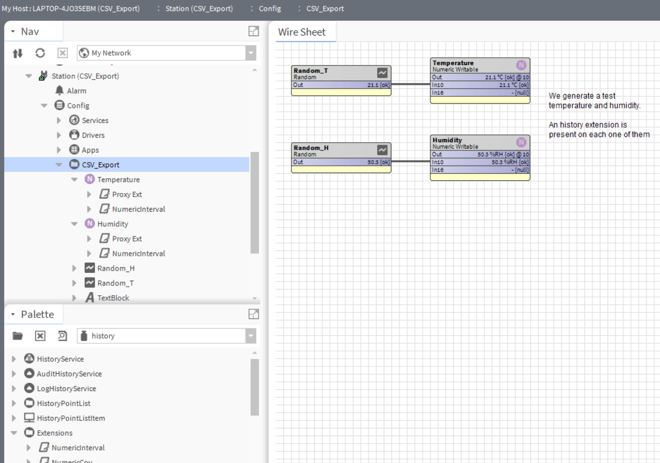
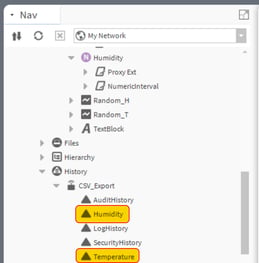
The history data should appear on the "History" section of the station
Using SeriesTransform to merge the 2 histories in a single table
SeriesTransform allows us to create a single table with multiple histories (which we are going to do here), but also roll up values, create "min", "max", "sum" and "average" values from multiple histories using the "Aggregate" block, or time shift the same history to compare values from a previous time frame next to each other.
We are not going to cover all the functionalities of SeriesTransform in this article, but once you grasp the basics here, you can explore the rest or take part on a TCP Advanced class to run through it with an instructor.
Open the SeriesTransform palette and drag a "TransformGraph" component to the CSV_Export folder wire sheet view.
Right click on the "TransformGraph" and open the wire sheet view.
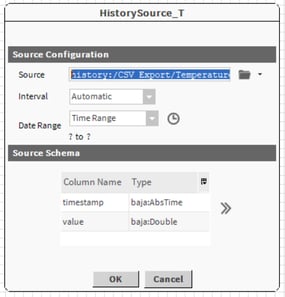
Add a "HistorySource". Double click it to open the properties pop up
Change the "Source" and select the Temperature history. Click "OK" to store the settings first, then double click it again. Select the chevrons below >> and remove the "trendFlags" and "status" entries clicking the - sign on the right
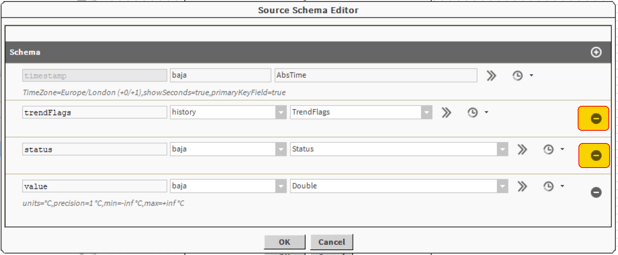
Your "HistorySource" property should look like this
Now duplicate this "HistorySource" and on the properties select the Humidity history
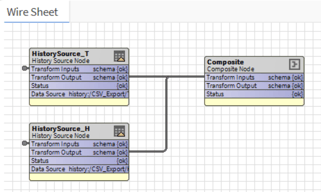
On the SeriesTransform palette, expand the "Nodes" section and select a "Composite" node.
Drag it on the wire sheet and connect it as shown
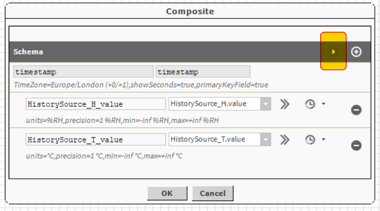
Double click the "CompositeNode" to open the property pop up. Press the "play" button to load the information, you should see this
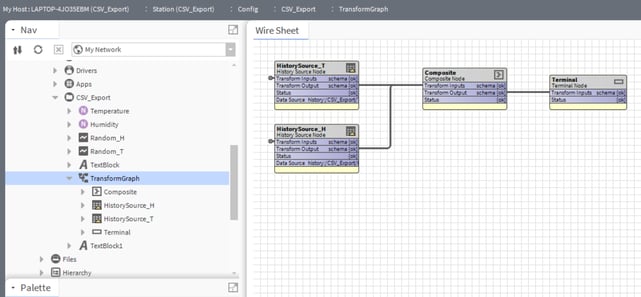
Drag a "Terminal" component from the SeriesTransform palette and connect it up like shown below.
Your "TransformGraph" wire sheet view should look like this now
Going back to the CSV_Export folder, you can right click on the "TransformGraph" component and select "Resolve Graph"
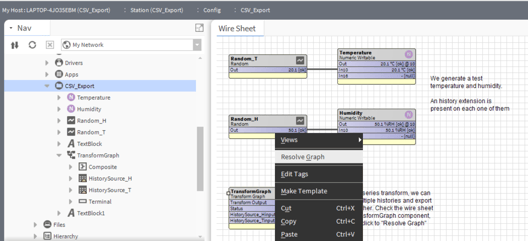
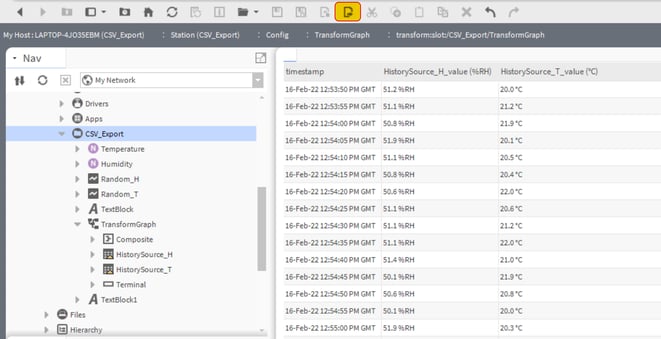
This will generate a table that where you can view your result data merged perfectly between Temperature and Humidity, a table that can be exported manually using the export button highlighted below
Generate a CSV automatic report from the table above
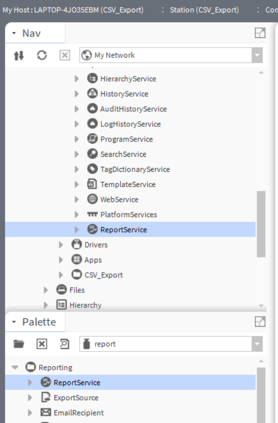
First of all, we need the "ReportService" to be running.
Open the "Report" palette, and drag a "ReportService" to the station "Config - Services" section, as shown
Now open the VykonPro palette. From there, expand the folder "Report" and drag 2 components: a "VykonProReportSource" and a "ReportFileRecipient", connecting them together as shown here
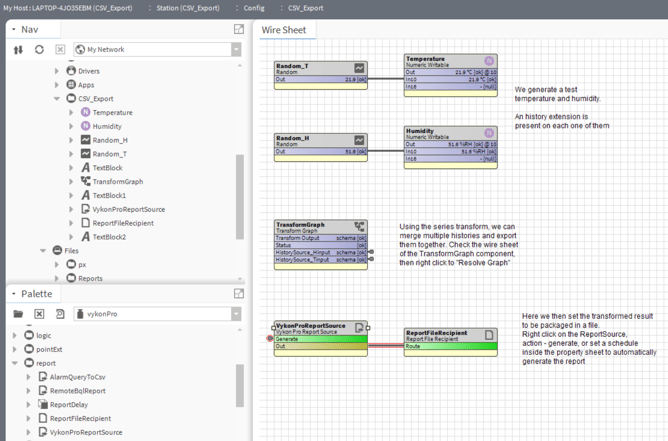
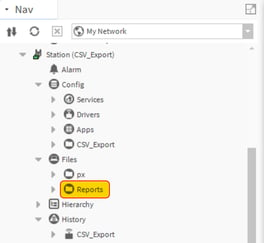
You might want to create a folder in your "Files" section of your station. I called my folder "Reports".
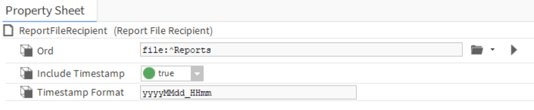
On the CSV_Export folder wire sheet, double click the "ReportFileRecipient" component to open the property sheet view. Make sure you select the "ord" to use the "Files - Reports" folder just created
Finally, we need to setup the "VykonProReportSource" component. To do that, we need first to run a couple of steps.
Right click on the "TransformGraph" and select the "Resolve Graph" option.
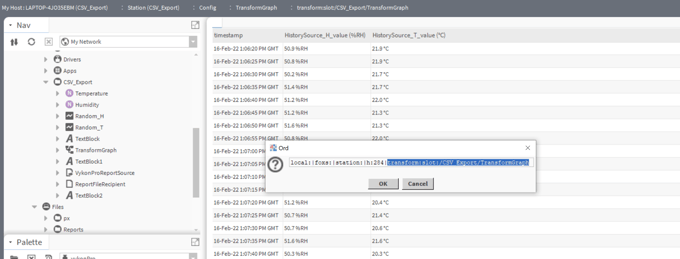
Once the table is visualized, we need to get some part of the ORD of that table for our configuration.
With the table shown on the Main View panel, push on your keyboard the keys CTRL+L
This will pop up the ORD of the section visualized on the main view panel.
From the ord visualized, select the final part from "transform:slot:" onward and copy it (see below)
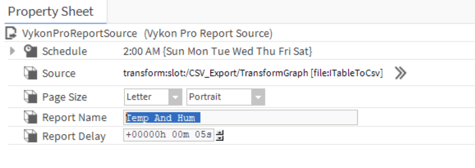
Go back to the CSV_Export wire sheet view, double click the "VykonProReportSource" component to open the property sheet view
On the "source" section, paste the path previously copied, like shown
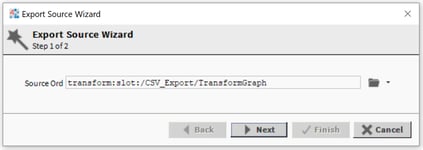
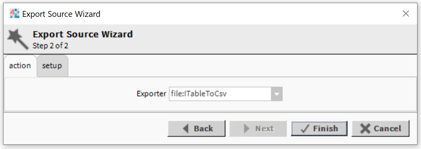
Hit "Next", then change the Exporter section to "file:|TableToCsv" as shown, then hit "Finish"
On the "Report Name" select the prefix you want to use for the report file name. Remember also you can set up the "Schedule" section to decide when the report should be automatically generated
Hit "Save" and go back to the wire sheet view of the folder CSV_Export
Now, right click on the VykonProReportSource, and select "Actions - Generate" to verify your work.
On the "Files" section of the station, under the folder "Reports" we will see a new CSV file being generated, containing the values of our series transform
Optional: email the report
You do not need to generate a file report and then send it via email. You can simply route the source to an Email Recipient.
Remember that for this to work you will need to have the Email module installed if you are working on a Jace, and the "EmailService" available from the "Email" palette correctly placed in the "Config - Services" section of your station.
Once all of the above is clear, you need to open the "Report" palette (not the email one) and drag a "EmailRecipient" to the wire sheet of CSV_Export. Connect the VikonProReportSource block as shown and set the "EmailRecipient" users as desired, job done!