The basic: check your station Resource Manager
Right click on the station and select "Views - Station Summary"
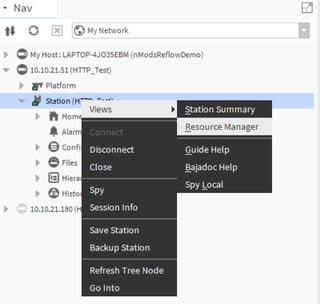
This will open up a resource monitor page where you can check CPU and memory usage
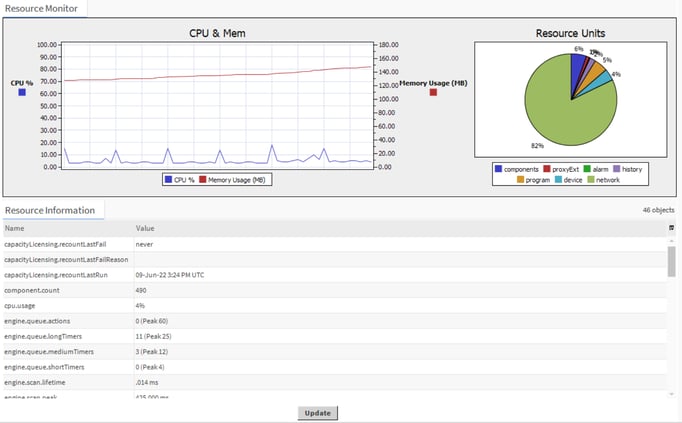
The CPU should never exceed a constant use over 80%, while peaking over 80% would be normal.
The list below will be useful also for at least a couple of things, to name a few:
- to check the amount of proxy points used against your license
- to verify the usage of Heap Memory
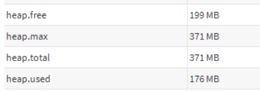
You should never use more than 75% of the total available heap memory. Heap Memory is primarily used by station modules and java program objects, so if the memory usage is high, these 2 might be the main reasons
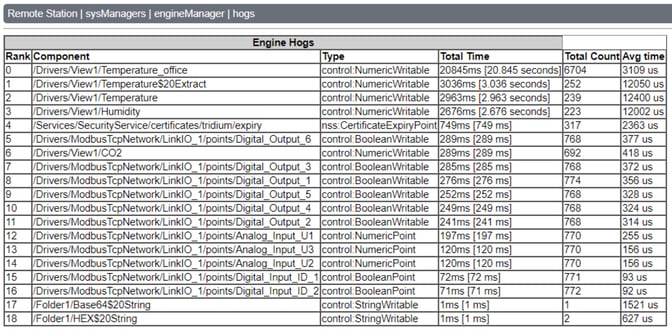
Check the "Engine hogs"
Right click on the station like before, but this time select "Spy". From the main view, click on "sysManagers", then "engineManager" and then scroll down to find "Engine Hogs"
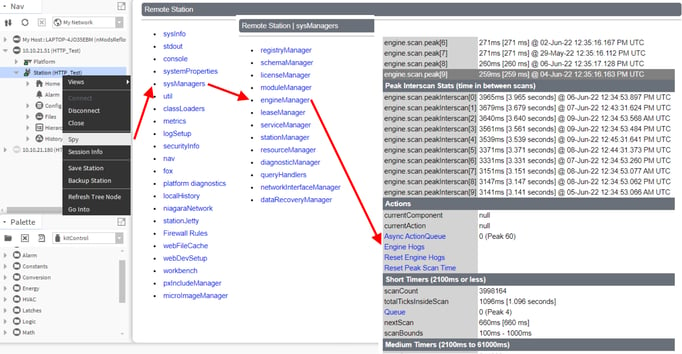
Clicking that, a list of the main components of your station will open up, and a column on the right hand side will display the average execution time of the component. If you see things taking a long time to run, probably it is a thing that you want to double check in your station and maybe find a way to relief the Jace/Niagara controller. There isn't "a rule" to define the "long time", but let say half a second or above could be already something to be worth looking at. Half a second would be displayed as 500.000us (micro seconds).
Check the driver poll rates
Drivers that are based on polling data, like Modbus or even BACnet when COV is not enabled, will constantly run commands to read data based on the fast, normal and slow configured rates.
In my station below, I have got a few Modbus points all polling using the "normal" rate, which is polling every 5 seconds
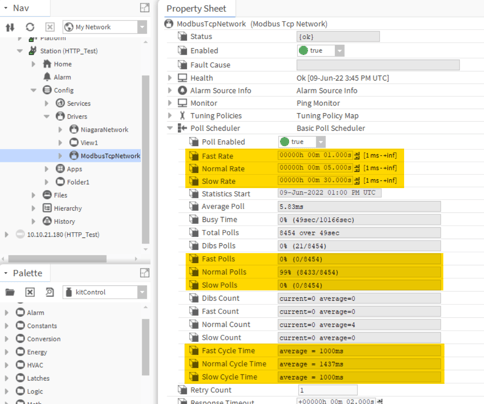
Looking at the property sheet of the driver, it becomes important to verify that the cycle time (see the bottom part highlighted in yellow) for each rate (fast/normal/slow) is always equal or below the actual time configured for such rate. So the average for the Fast Cycle Time for me should be always 1 second or below, 5 seconds or below for the Normal Cycle Time and 30 seconds of below for the Slow Cycle Time. Seeing a longer cycle time is usually an indication that this network is saturating with commands and usually that is indicated by a slow Jace/Niagara controller and heavy use of the controller resources (check the Resource Monitor).
In this case, the driver will need to be optimized, either by slowing down the network, or optimizing it. If using Modbus, have a look at THIS ARTICLE about how to optimize a Modbus network!
Use the Application Director console to debug your network (or component)
The "Application Director" (under "Platform") shows a live console output, and it is the best place to check for station errors and make sure everything is running as it should. Your TCP teacher should have taught you how to use it, but below you find a refresher on how to add more information to it
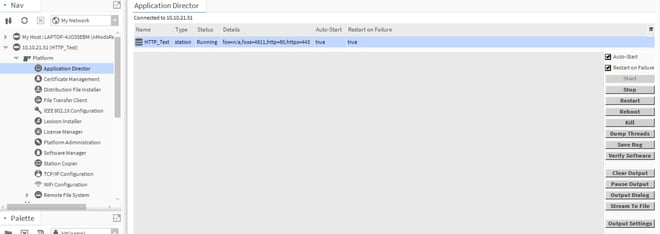
Copy the content of the Application Director, or "stream to file" to send the content to your Tridium expert or support reference. It is going to be essential to help your reference engineer or the support team to understand why you are experiencing problems in your station. Or why not, it is going to help you identifying where to focus your attention for a solution.
How do I add more debug information to my Application Director console
Though most main errors might show up in the Application Director console, debugging an issue might need to show more details on here, so that you can investigate with more information in your hands.
There are 2 ways to enable more information to be displayed on the console. Both will lead to the same result and an action on one will be seen on the other method as well.
Method 1: using the "Spy" method
Right click on the station, and select "Spy". Then, select "logSetup" on the main view
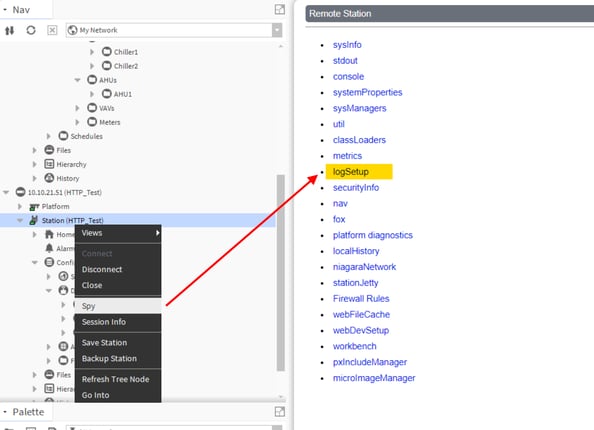
A long table with all the components used in your station will open up
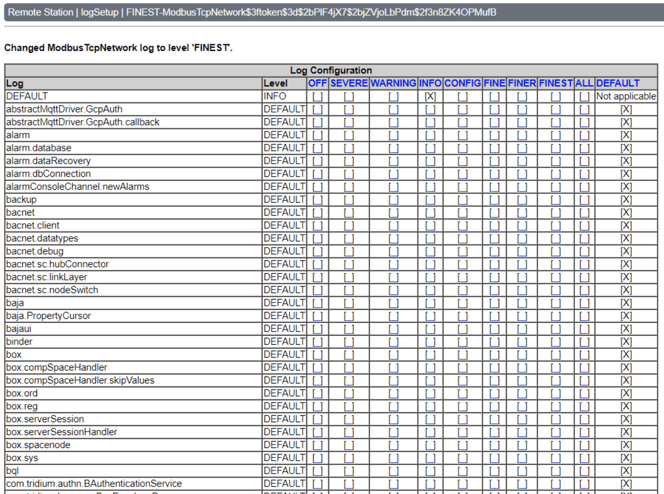
Look at the top part, and you will notice that for a component you can select to show on the Appllication Director more information for each component.
Let say I wanted to debug my Modbus Network. I might want to show all the Modbus traffic generated.
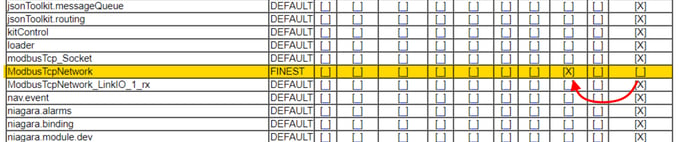
I locate my "ModbusTcpNetwork" driver, and move the flag from default to "finest"
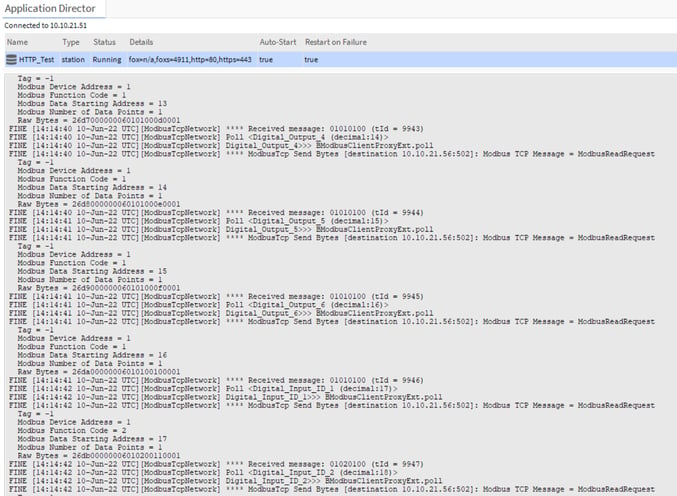
Now my Application Director console is showing me all the details of what is going on there, helping me verifying for instance how many modbus command I am running, how many registers I am asking at once, and if there is an error:
Method 2: using the Services - Debug Service
The same of the above can be achieved by looking into the Services section of your station, and double clicking the "Debug Service"
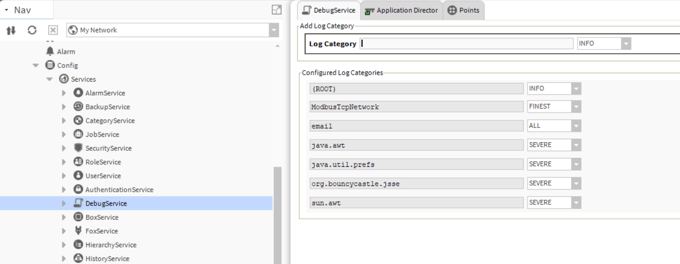
Notice that the "ModbusTcpNetwork" "Finest" line already exist, as I added it using method 1.
If you wish to use this method, simply find the component from the "Log Category" by typing the first letters of it, and selecting it. Then select the type of log from the drop down menu, and press the "+" button on the far right to add the new line. Removing the line will be equivalent to set back the debug of that module to "default"
What if I want to recover the content of the console after a reboot
If your controller rebooted and you want to recover the content of the console before it rebooted, there are backups of the latest console outputs available.
Right click on the station and select "Spy", then "console"
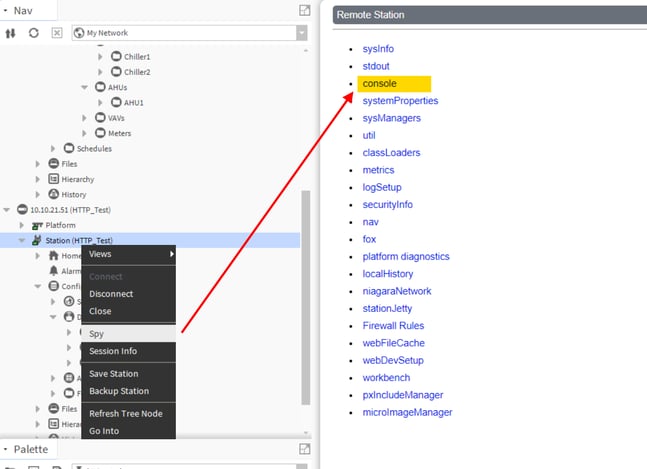
This will give you access to a few console outputs recorded just before the reboot in txt format, like you can see here below:
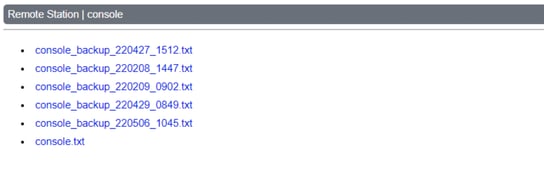
You can double click the file from here to view it within the workbench directly.